IEM Equalization Extravaganza
8 October ’22
Audiophiles see In-ear monitors (IEMs) as an inexpensive way into audiophilia. Sure, with the recent rise of the “chi-fi” it has never been so cheap to have access to good sound quality. Still, a certain sound signature might not be to the tastes of everyone, not to mention different ears will literally hear things differently. In such cases, one has the possibility of applying equalization to change the signature of audio hardware.

The legendary Moondrop Blessing 2:Dusk
Before we proceed
Before we dive into IEM equalization, there’s a few topics I need to introduce to make sure we’re all on the same page.
Tonality
Tonality is basically how a sound reproduction device outputs each part of the frequency spectrum. That is to say, it will determine how much bass, mids and treble the sound will ultimately have.
As with every hobby, it can always get more complicated. Usually we divide tonality into sub-regions, such as “sub-bass”, “upper-midrange” and “air region” (high treble). There are no precise definitions of where exactly in the frequency spectrum each area is located, and the terms only provide a general idea.
The famous IEM reviewer crinacle has his own definitions, which are as follows:
- • 20Hz to 80Hz: Sub-bass;
- • 80Hz to 200Hz: Mid-bass;
- • 200Hz to 800Hz: Lower midrange;
- • 800Hz to 1.500Hz: Centre midrange;
- • 1.500Hz to 5.000Hz: Upper midrange;
- • 5.000Hz to 10.000Hz: Treble;
- • 10.000Hz+: Upper treble/”air”.
IEMs vs headphones vs speakers
At this point, it is important to understand that different types of devices should have different frequency response curves.
In a way, speakers have it easy. The sound they output travel along your room, and reach your body like any other “natural” sound would. That is, it will reflect on surfaces, shake your body, interact with the fine structure on your ear’s pinna, until it finally reaches your eardrums. Therefore, whatever influence these things have on the sound, the speakers’ job is merely to reproduce audio like a natural source would, and both will go through the same interactions.
Now headphones, on the other hand, have a trickier job to perform. They do not interact with the environment, and also bypass most of the interaction with your body. Over-ear headphones do interact with your pinna, but they do so blasting sound at a direct angle onto your ear canals. This is quite different from what a natural sound goes through, and if a headphone does not account for that in its sound signature, it will not sound correct to our brains.
Finally, IEMs have it even worse, because they bypass the pinna completely and output sound directly down your ear canals (which are also sealed by the IEM).
All of that is to say: different types of devices will aim for different types of frequency response targets.
Frequency response targets
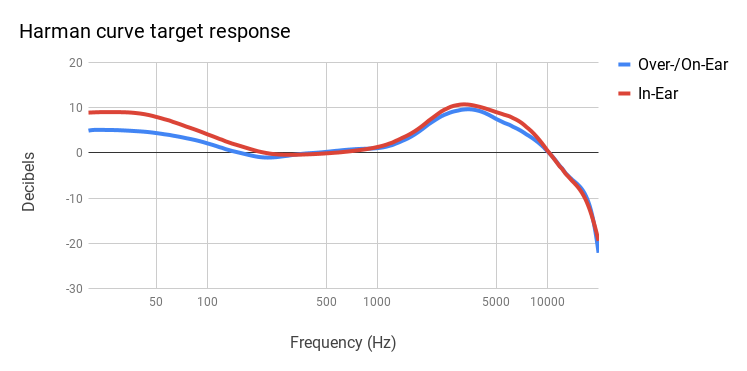
For the remainder of this post, I will focus on IEMs. One of the most famous target response curves in the IEM world is the Harman IE target (official paper).
The Harman curve is meant to capture the taste of what most people would consider “good”. It has what audiophiles sometimes describe as a “V-shaped” tonality: lots of bass (mostly focused on the sub-bass area) and goes up again on the treble region. It also accounts for an increased output in the region around 2~5KHz, meant to emulate the effect the ear pinna has on the sound that reaches our ears (remember, an IEM bypasses the pinna completely). This is usually referred to as the “pinna gain”.
Another important curve is the diffuse field target curve, created by Etymotic Research. This curve is meant to emulate the frequency response reaching the eardrums of a dummy head when sound is arriving at it coming from all directions uniformly. It is usually perceived as a “bright” signature, having more energy in the treble region that a Harman-tuned IEM would.
Other curves exist, such as Moondrop’s own in-house Virtual Diffuse Sound Field (VDSF), or reviewer curves such as crinacle’s IEF Neutral.
“Technicalities”?
Usually audiophiles divide the sound signature analysis into two groups: tonality and technicalities. Some aspects of the sound signature are hard (or maybe impossible) to describe using frequency response (the tonality) alone. This is where other, more abstract terms start to show up: “soundstage”, “imaging”, “attack speed”, “texture”, “details”, etc…
Crinacle goes over these topics in great detail on this article, where he states:
Do note that whatever I write here is still mostly “pseudoscience” in that most of the things here aren’t peer-reviewed or academically researched (or scientifically accurate, for that matter!)
I find it quite surprising that in this day and age most of what we use to describe audio is still highly unscientific, veering into the “it’s an art” territory. But nevertheless, this is the state of things. My own personal, unscientific view, is that most of the “detail” stems from a reproduction of the treble region in an accurate and devoid of peaks fashion. Regarding “soundstage” and “imaging”, these are heavily tied to the Head-Related Transfer Function (HRTF), which varies from person to person and is especially hard for IEMs to emulate properly, which is why they tend to fare poorly in this aspect.
Measurements
Now, what use would target curves be if there were no way to measure and analyze how an IEM responds?
Measurements are a very complicated subject, which I do not have a lot of property to talk about, so I will give you some general pointers of where to go.
To measure the frequency response of IEMs instruments known as couplers are used. The IEM is inserted on the opening, and usually a sine wave sweep is performed on the IEM, which is then used to graph the amplitude of the sound reaching the coupler.
Due to ressonances inside the coupler, IEM frequency response graphs will always end up with some peaks in certain treble frequencies. For consistency, usually reviewers try to position the peak in the same place for every measured IEM, by varying insertion depth. For instance, Super* Review targets 8KHz for the ressonance peak.
As such, frequency response graphs should be used with care, and its limitations have to be considered. They are most useful when used as a comparison tool between measurements taken with a consistent methodology. Frequency response graphs can be used as an aid for equalization, but one has to be mindful of such limitations, and also differences from person to person (your ear is not a GRAS coupler!), unit variance, etc…
Crinacle goes in-depth into IEM measuring equipments
Equalizers
If you’re here, I assume you’re reasonably familiar with the concept of audio equalization. Still, I will expand a bit on the two most common types of equalizers: band and parametric.
Band equalizers have filters at specific, static frequencies. They usually provide the user with a simple interface containing multiple bands at certain set frequencies, and the user is able to increase or decrease the amplitude of the audio around each frequency. These are fine for some coarse corrections, but due to the fixed bands it’s often not possible to execute corrections exactly as desired.
For more precise corrections, we use parametric equalizers. I will leave it to the folks at PreSonus to provide a more in-depth explanation, but I will very quickly go through the main concepts intuitively. A parametric equalizer filter is composed of three parameters: frequency, Q and gain. Q stands for “quality” (which is a bit of a deceiving title).
- • Frequency: the frequency at which the filter is centered at;
- • Q: the “spread” of the filter. A small Q value means the filter is very wide, and a large Q results in a very narrow filter;
- • Gain: The amplitude at the center of the filter.
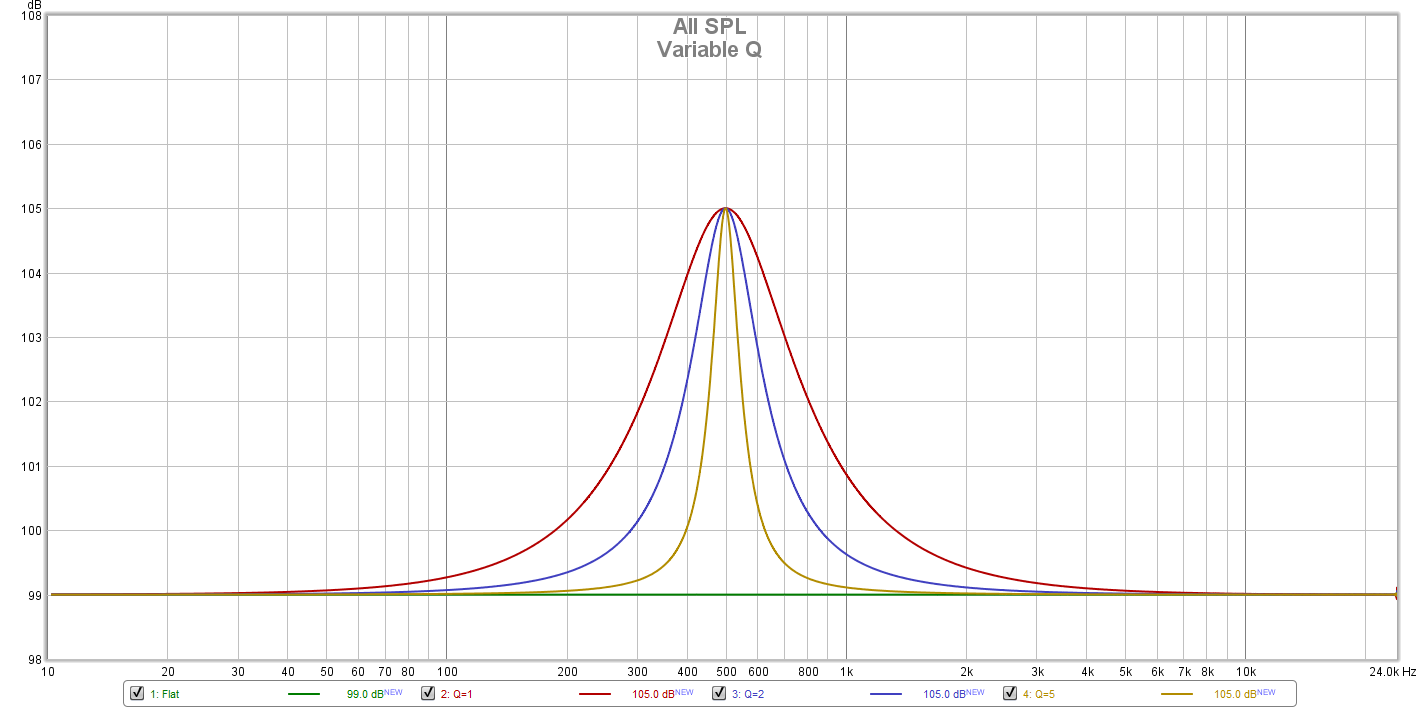
Different Q values, image courtesy of JRiver
A very useful tool to build and analyze parametric equalizers is crinacle’s graph comparison tool. It is an open-source tool available on GitHub, made by Marshall Lochbaum. However, my favorite implementation of it is Super* Review’s Squiglink. I even have my own deployed here!
There are many softwares which you can use to apply band and parametric equalizers, I will mention some which I use and enjoy.
Wavelet is an Android app that allows you to use system-wide equalization. It has a built-in band equalizer with 9 bands, and a convolution equalizer. I will not go into details about convolution equalizers, but suffice to say we will be able to export a Wavelet settings file using CrinGraph’s parametric equalizer (more on that later).
AutoEQ is a project and not a software per se, but a very relevant one.
AutoEQ is a project for equalizing headphone frequency responses automatically, and it achieves this by parsing frequency response measurements and producing equalization settings which correct the headphone to a neutral sound.
It includes a huge database with over 4000 measurements, and parametric equalizer settings tuned to the Harman target. Wavelet has built-in support for the AutoEQ database using its AutoEQ function. However, we will export our own equalizer curve later.
Finally, we have Equalizer APO, an open-source Windows equalizer. It has graphic, parametric and convolution equalizer support, among other features. It’s usually used in conjunction with the Peace interface.
We are now ready to go into the densest part of this whole thing, which is how I came with my own target curve to help me equalize my own IEMs.
My own target curve
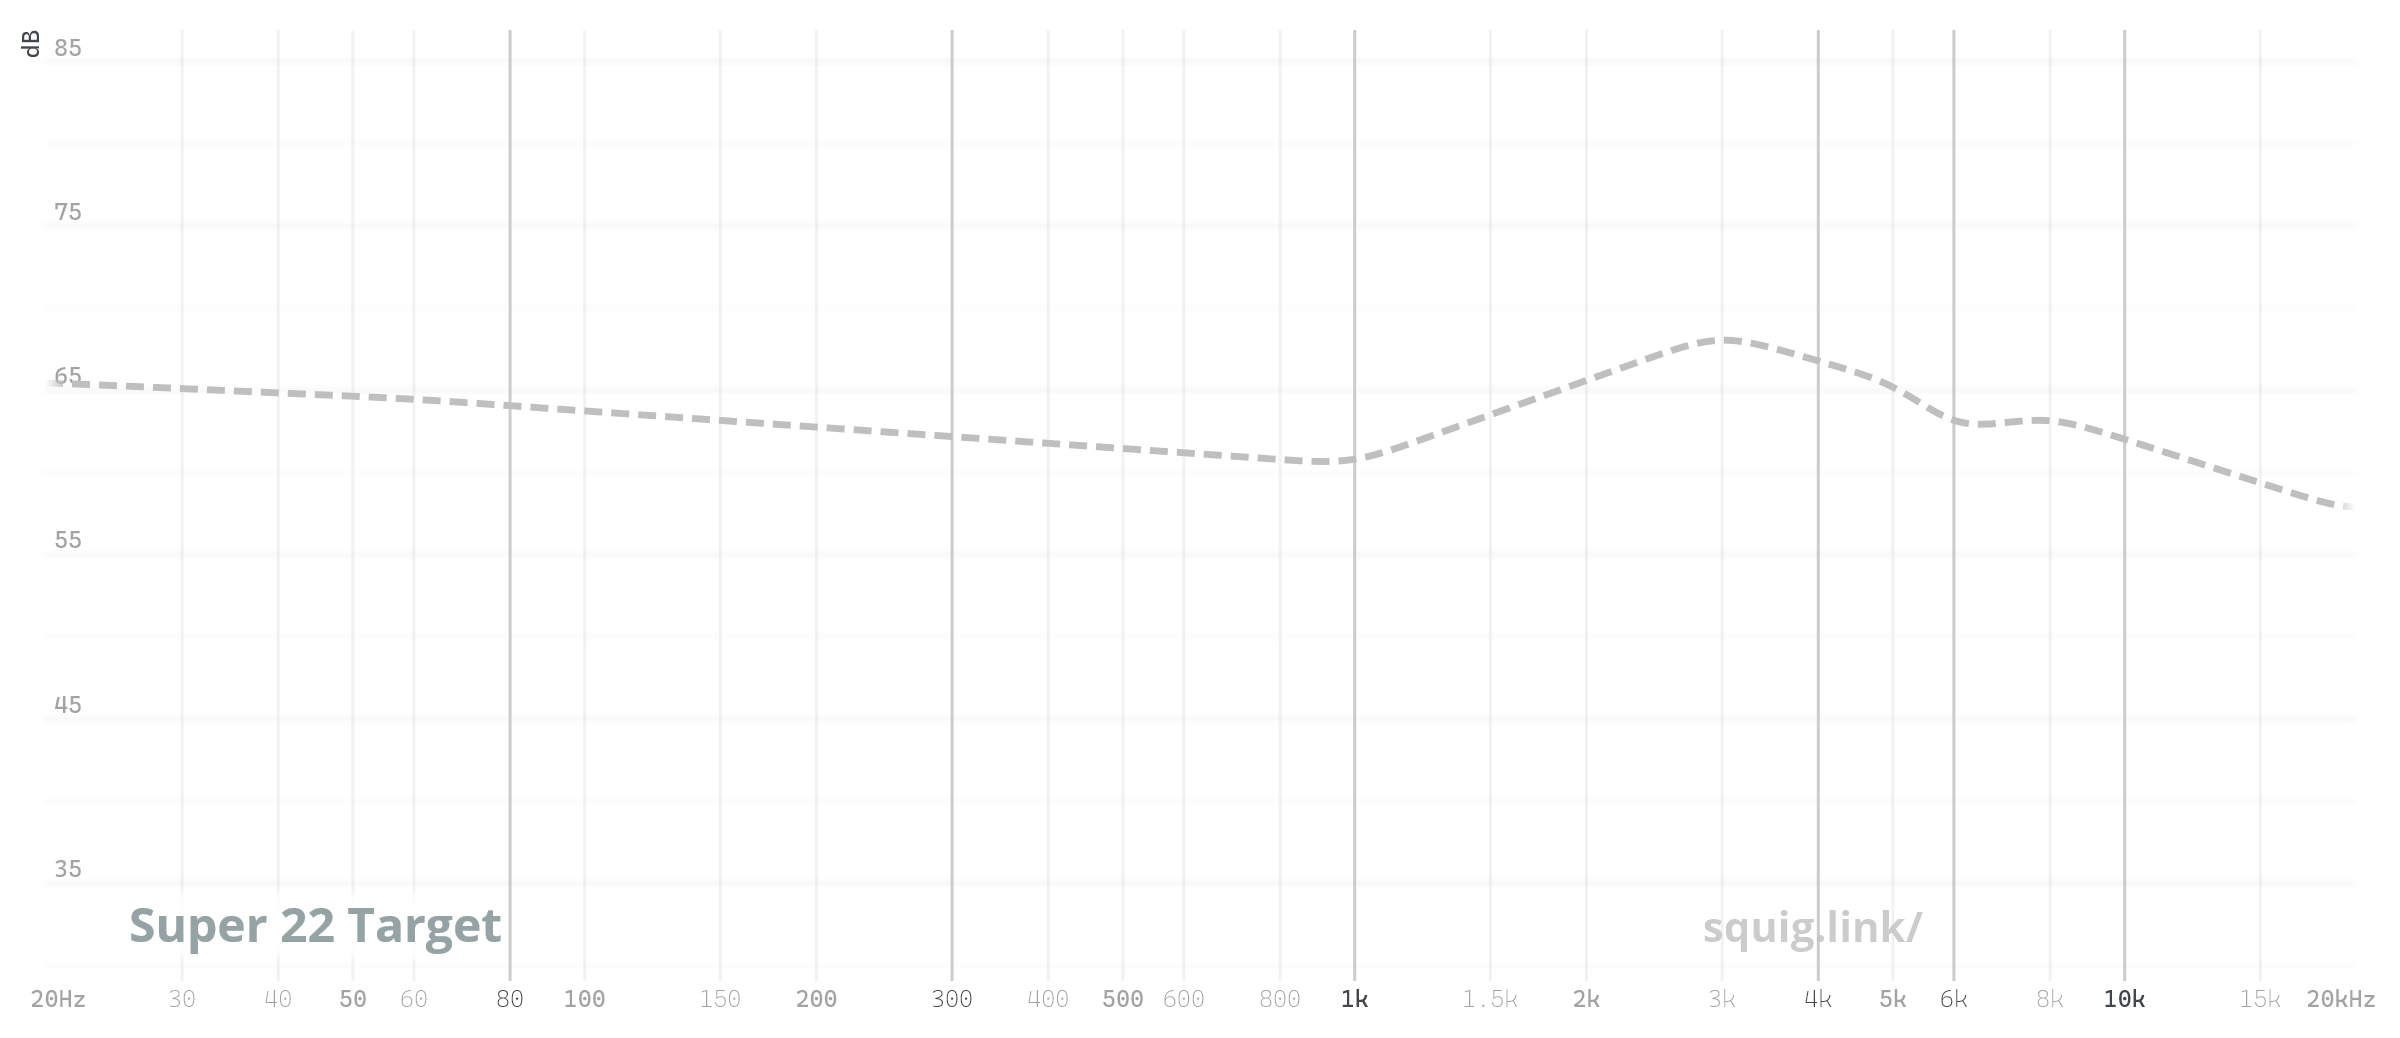
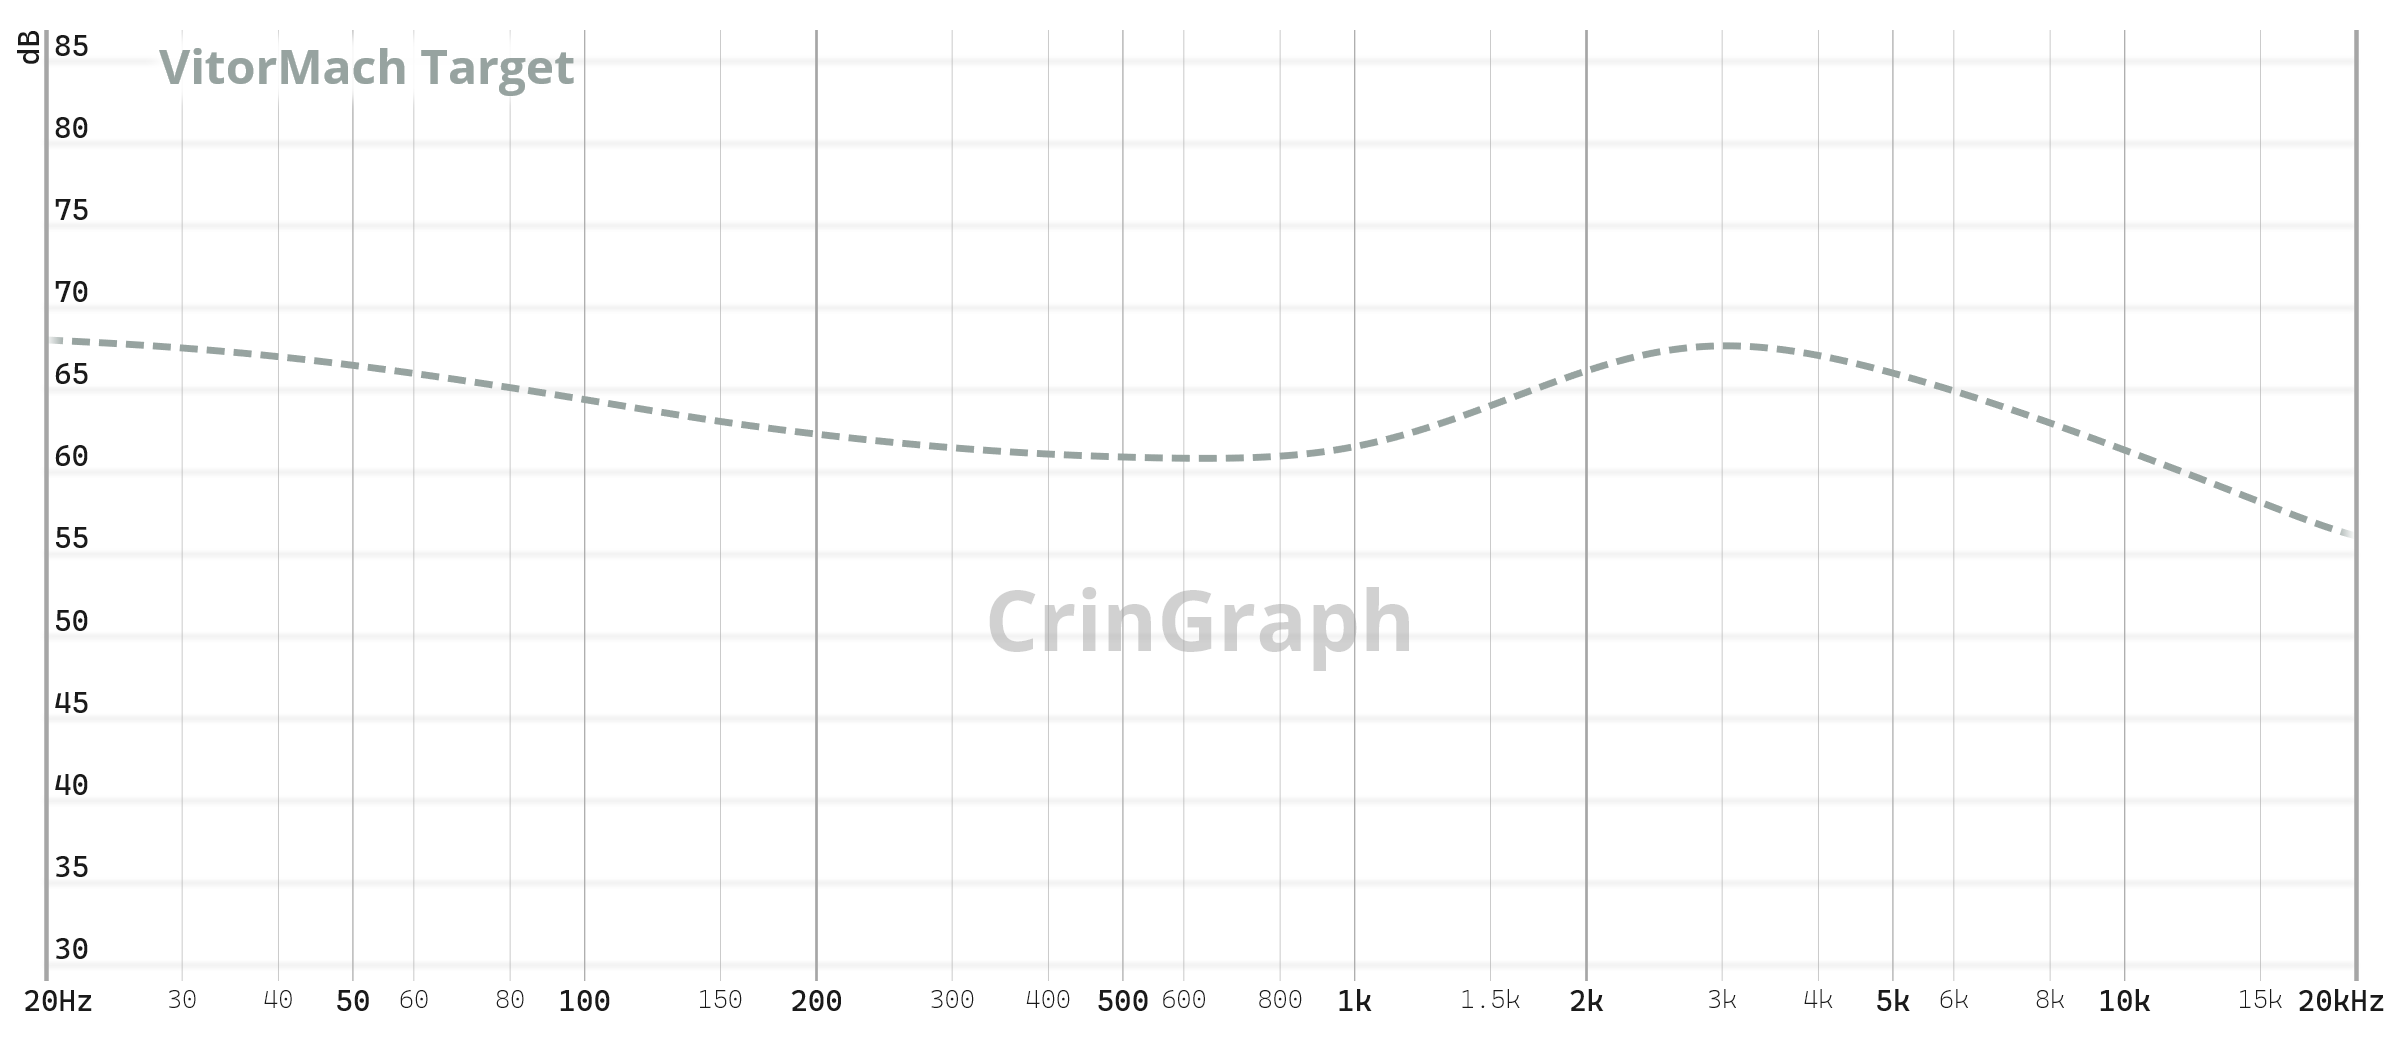
I’m not a huge fan of the Harman curve. It has too much bass for me, and I’m also quite sensitive to the 8KHz region, which is very prominent in the Harman curve. The new Super 22 target curve made by Super* Review is much closer to my own personal tastes, and served as the basis for my own target curve.
The only things I have decided to change in the Super 22 curve were:
- • added slightly more sub-bass to increase the feeling of bass extension;
- • removed the scoop between 6~8KHz, which seems arbitrary to me personally.
Hence I came up with the VitorMach target:
But wait, how did I get here? Now, it’s time to dive deep into the technical part.
Room EQ Wizard (REW)
We’re going to use Room EQ Wizard (REW) to create the target curve.
Super* Review kindly provided this spreadsheet to help building the input file for REW. In the first tab (“Custom”), we will be filling in amplitude values (dB) for each relevant frequency we wish to key in. It is recommended that the 1000Hz value is kept at 100, and the other frequencies to be adjusted relative to it. You only need to fill in some of the frequencies, and when you export it, the target curve will be interpolated along them. Switch to the “Export” for more information on how to export the curve.
Here are the exported keypoints of my own target curve:
| Frequency | SPL (dB) |
|---|---|
| 10 | 107.5 |
| 20 | 107.2 |
| 30 | 106.7 |
| 40 | 106.2 |
| 50 | 105.6 |
| 80 | 104.2 |
| 100 | 103.5 |
| 150 | 102.0 |
| 300 | 100.5 |
| 500 | 100.0 |
| 600 | 100.0 |
| 1,000 | 100.0 |
| 1,500 | 102.5 |
| 2,500 | 107.1 |
| 3,000 | 107.5 |
| 3,500 | 107.1 |
| 5,000 | 105.0 |
| 10,000 | 100.0 |
| 20,000 | 94.0 |
| 22,000 | 93.5 |
Obs.: I have manually added in values for 10Hz and 22.000KHz to make the edges of the REW output smoother (the range we will export from REW will be 20Hz to 20.000KHz).
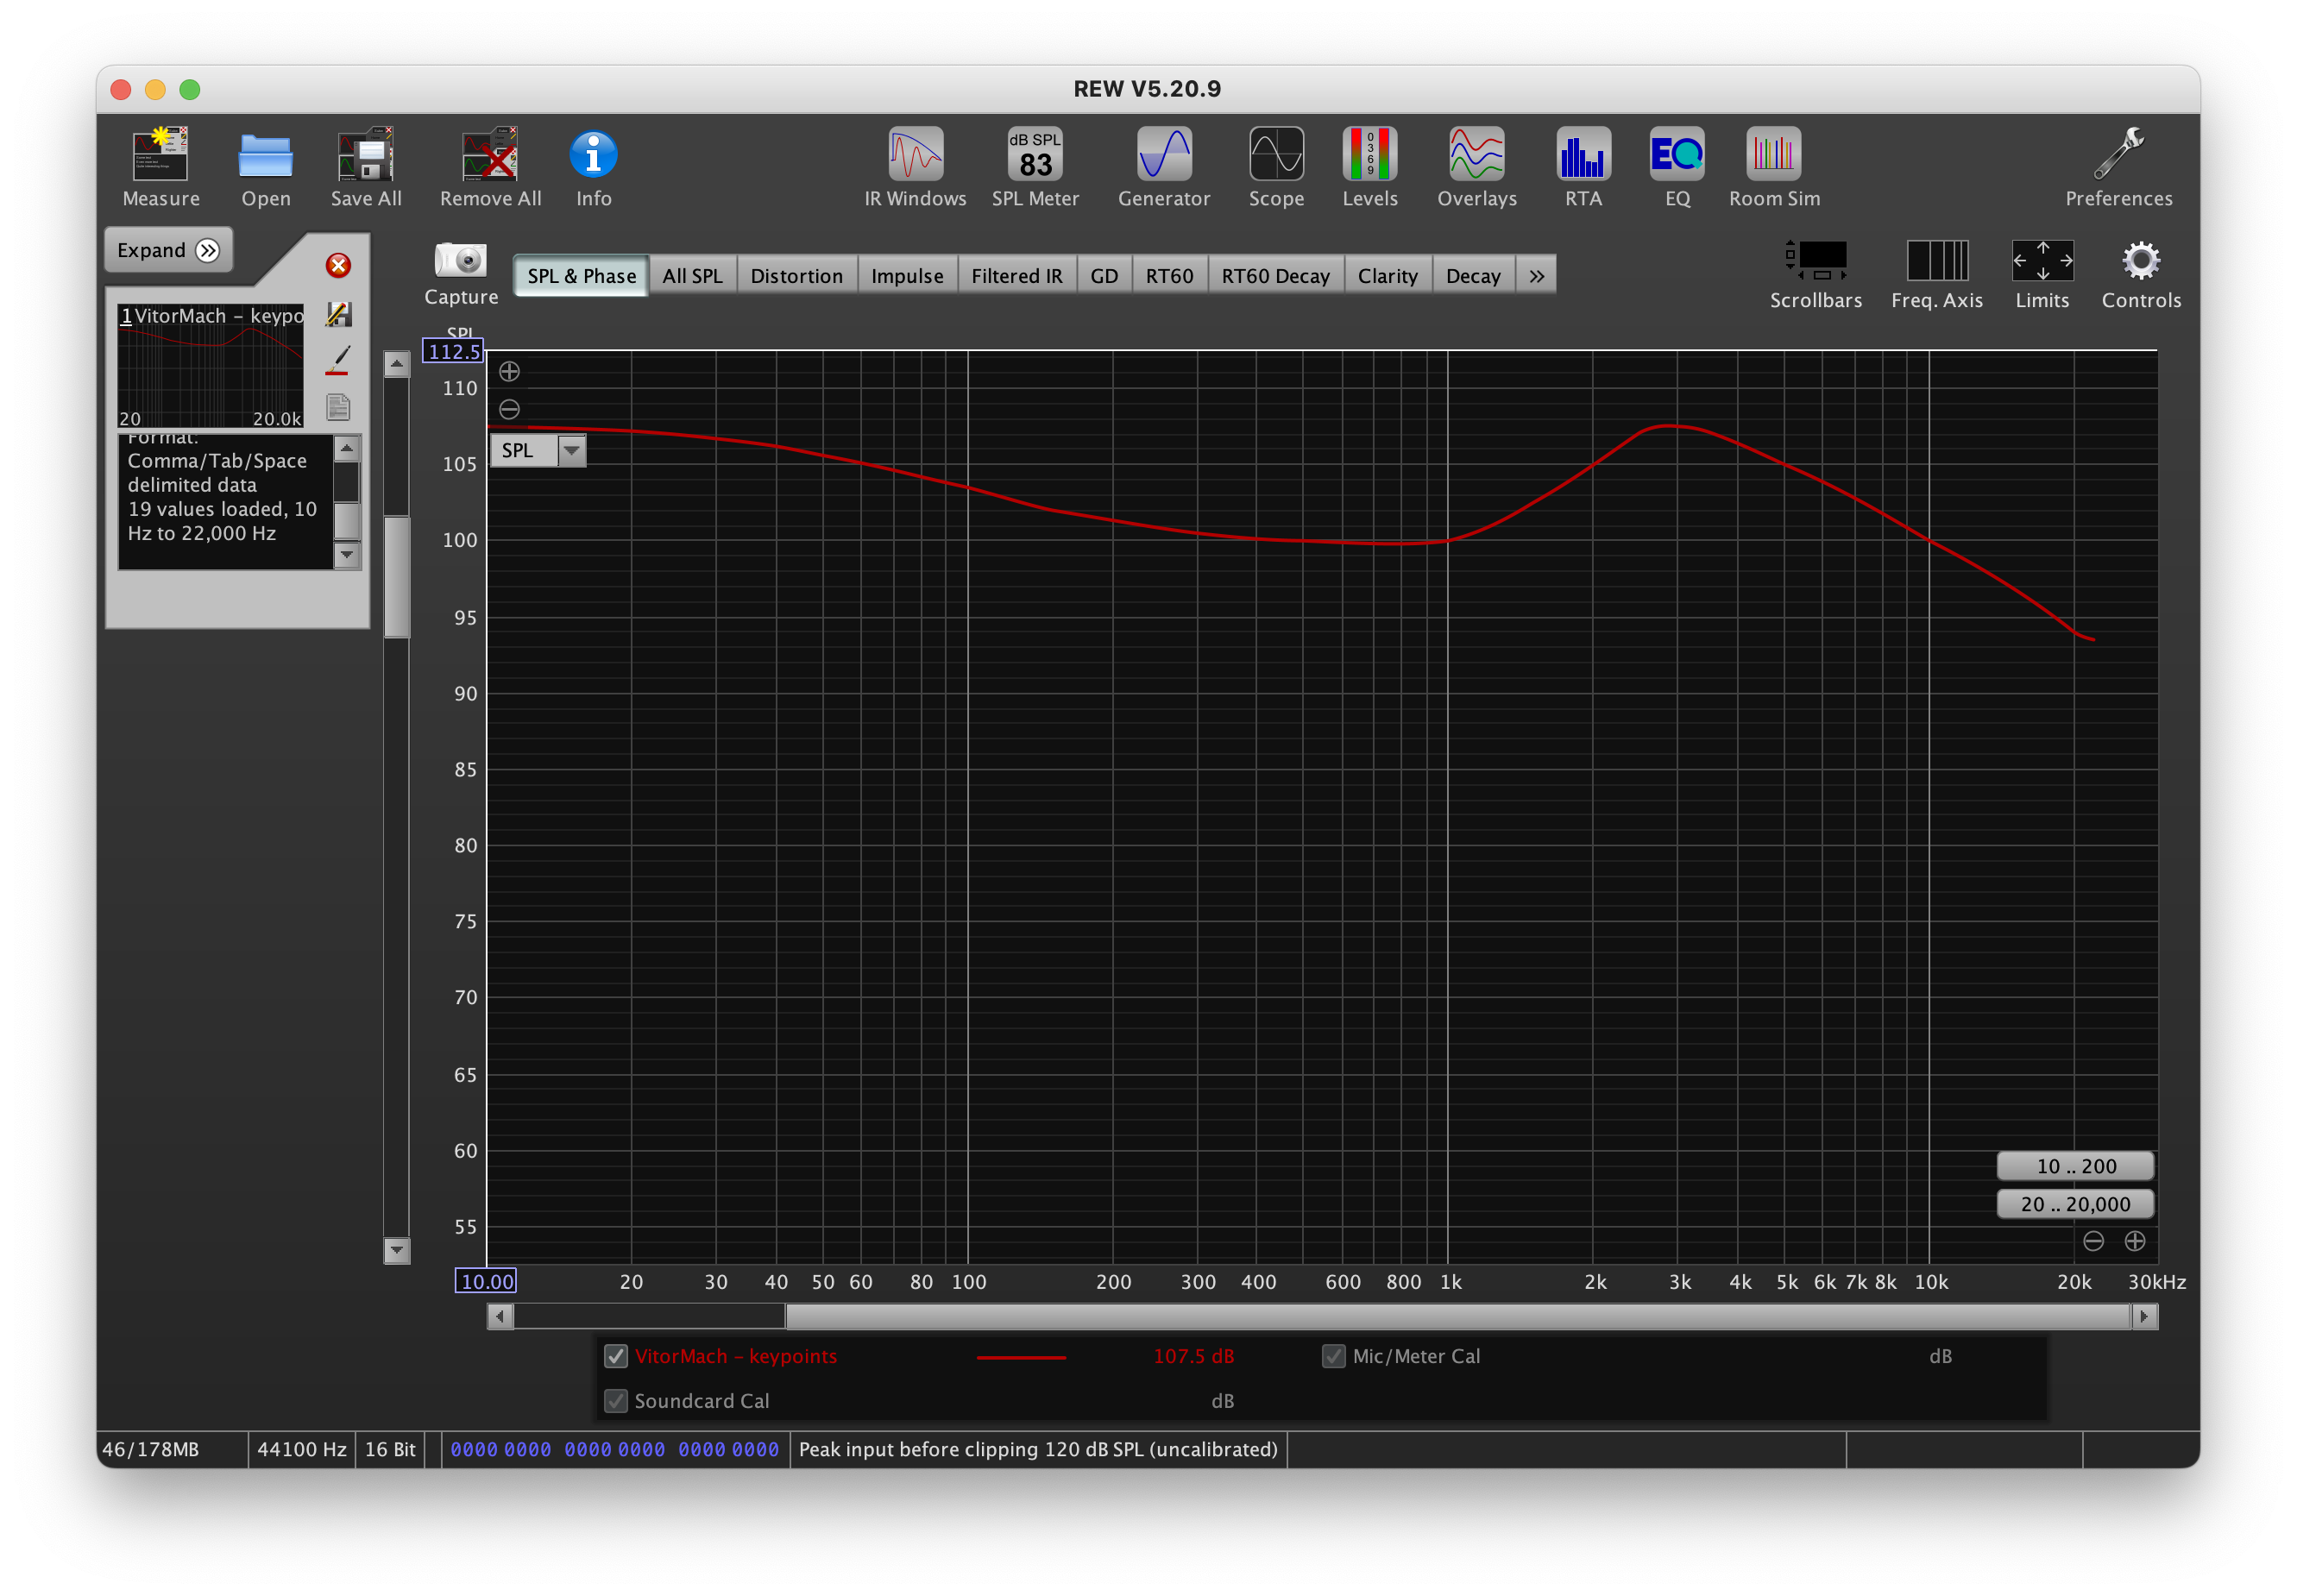
In REW, go to File > Import > Import frequency response. Choose your keypoints .txt file, and you should see this:
Go in the Graph menu and choose one of the smoothing options to make the curve less “jagged”. In my case I went full smooth and choose 1/1 smoothing (the strongest), but feel free to experiment.
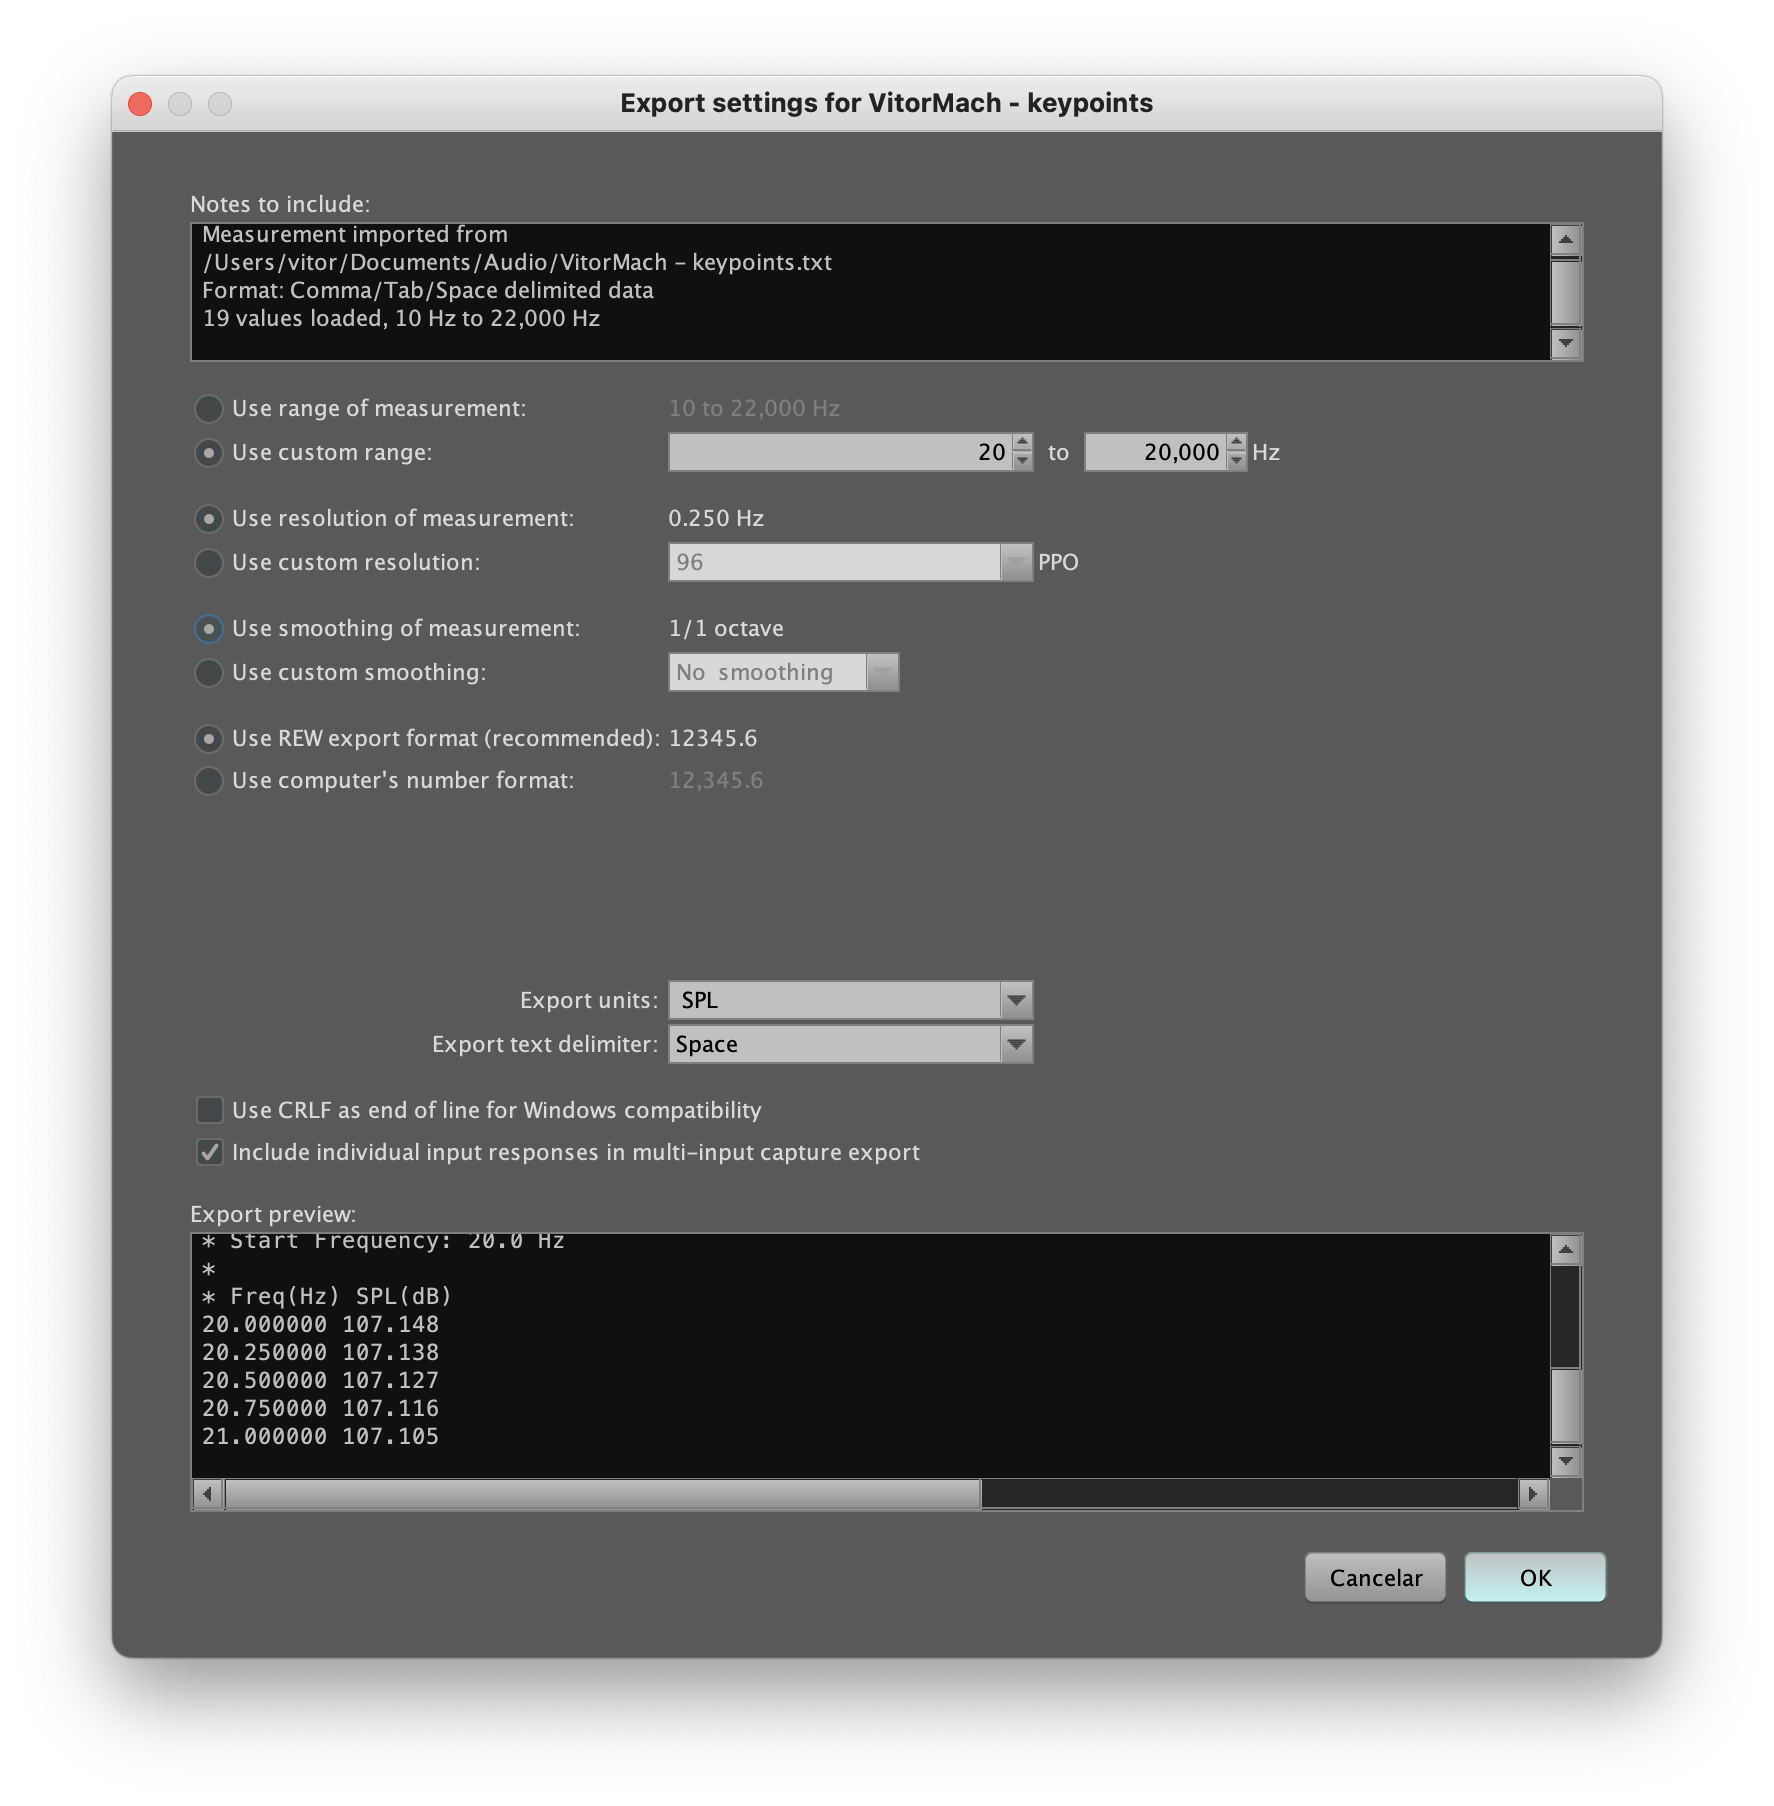
With that done, go to File > Export > Export measurement as text. Make sure your options look like this:
Click OK and save a new txt file. You will notice this file is much larger than your input, because it contains the interpolated values for the entire curve, not just your keypoints.
Using the target curve
With the target curve file in hands, it’s simply a matter of going to Squiglink’s Equalizer tab and clicking on “Upload Target” to use your own target curve.
With the target curve loaded, we can begin to use the parametric equalizer, and the AutoEQ function.
First, choose your IEM model in the Models tab. Hopefully it’s been measured, but if it hasn’t, check “Other IEM databases” down in the footer for other CrinGraph databases, maybe you will find yours in one of these.
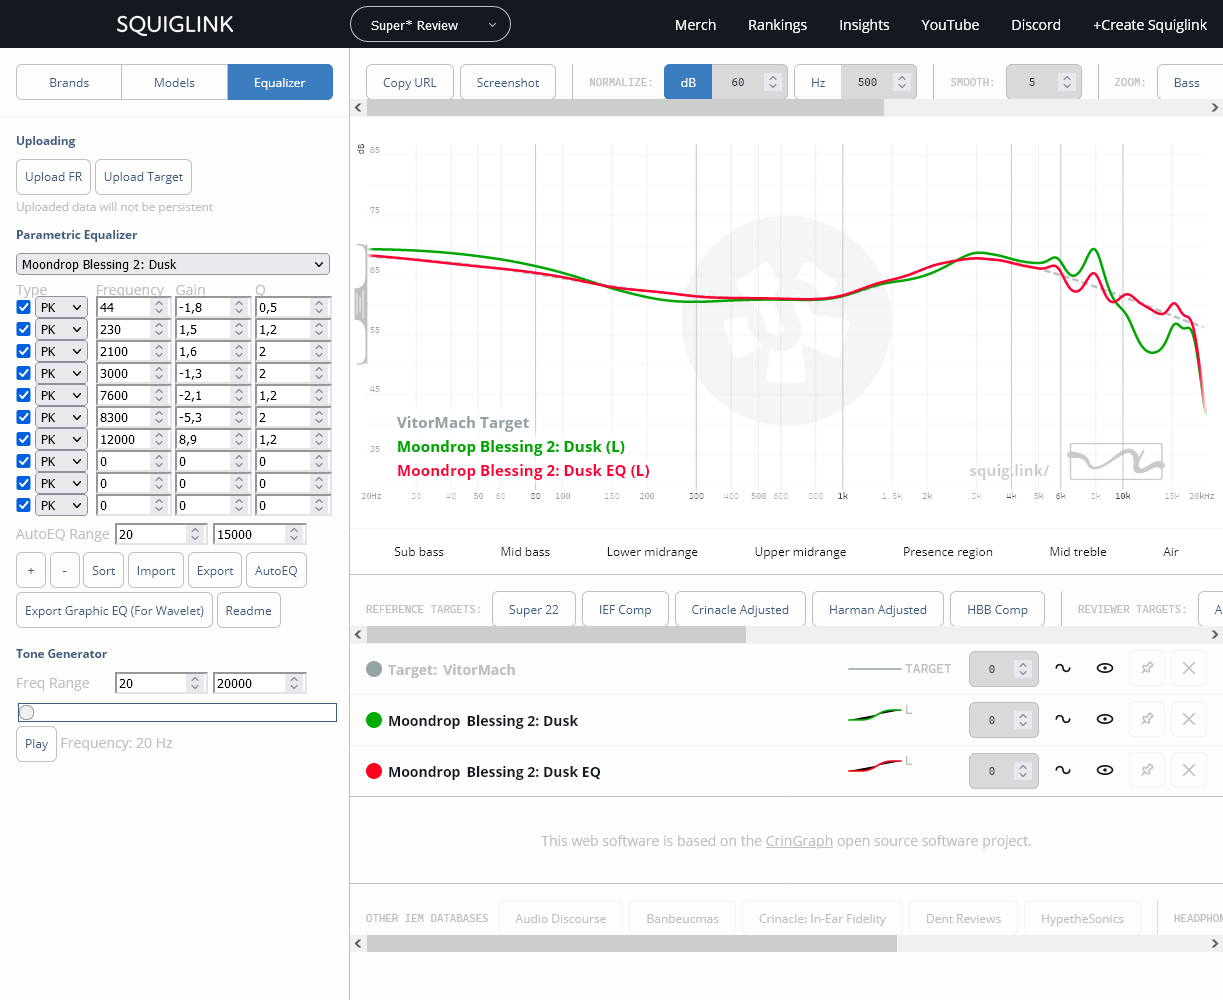
Now, back to the Equalizer tab, and we are ready to hit the AutoEQ button. You should see something like this:
There are a few things to note here.
First, the number of filters on the left sidebar will determine the maximum number of filters AutoEQ will use. The AutoEQ Range parameter specifies the frequency range which AutoEQ should try to equalize. I would heavily recommend not changing this range, because like I said before, the treble region measurements are very unreliable.
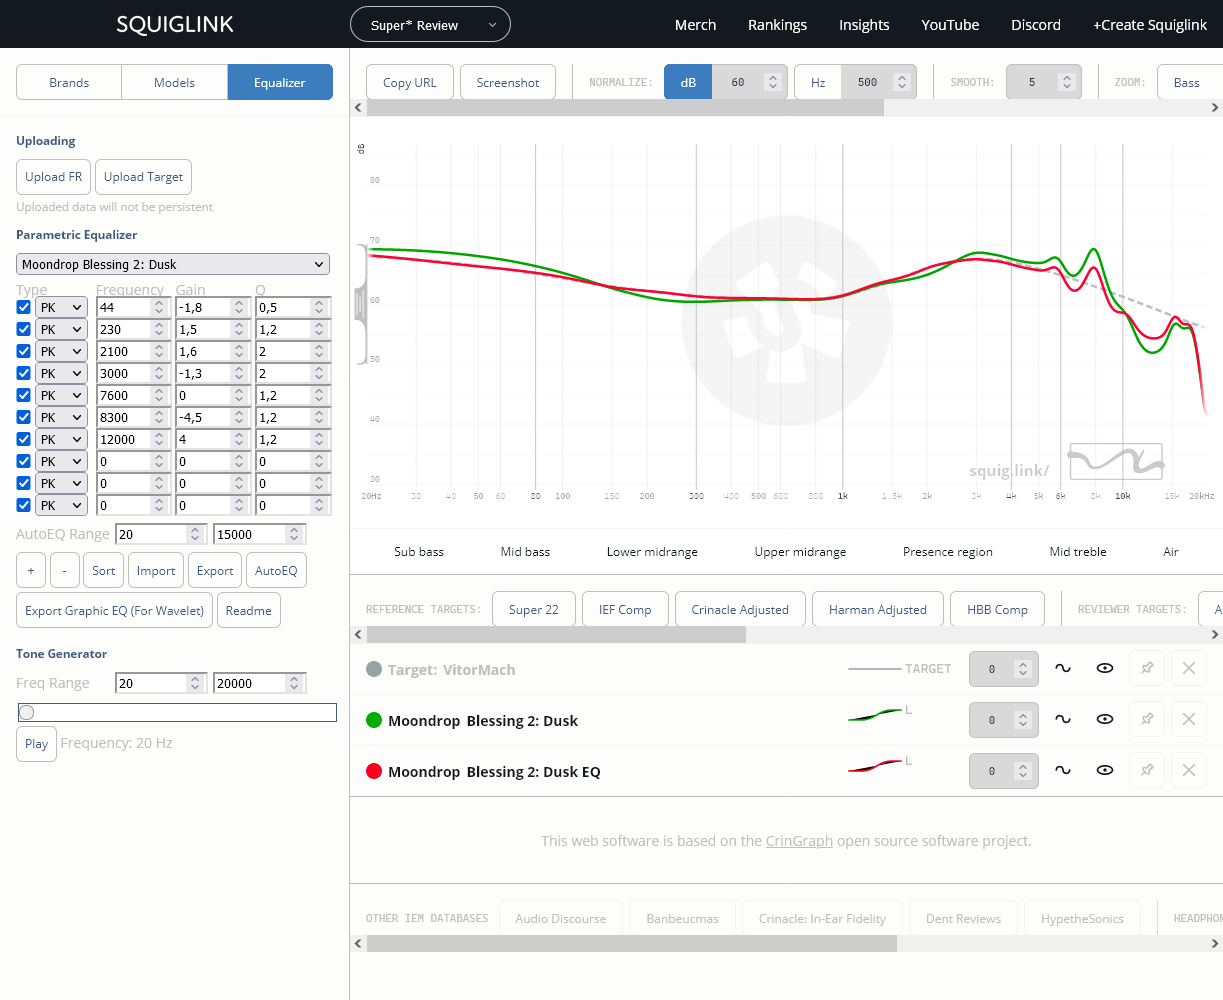
Speaking of unreliability, I would try to avoid using aggressive (high gain) and narrow (high Q) filters above 7KHz, because this might result in a “correction” that does not work well with your particular unit, or on your own ears. In the treble region, prefer wideband adjustments (low Q) and modest gain settings. Use the AutoEQ result only as a basis, and tweak the values on the left sidebar.
You should end up with something like this after some tweaks on the treble region:
When you are ready, you can hit the “Export Graphic EQ (For Wavelet)” button if you wish to export a convolution settings file for Wavelet, or you can simply reproduce the parametric equalizer values on your equalizer software of choice.
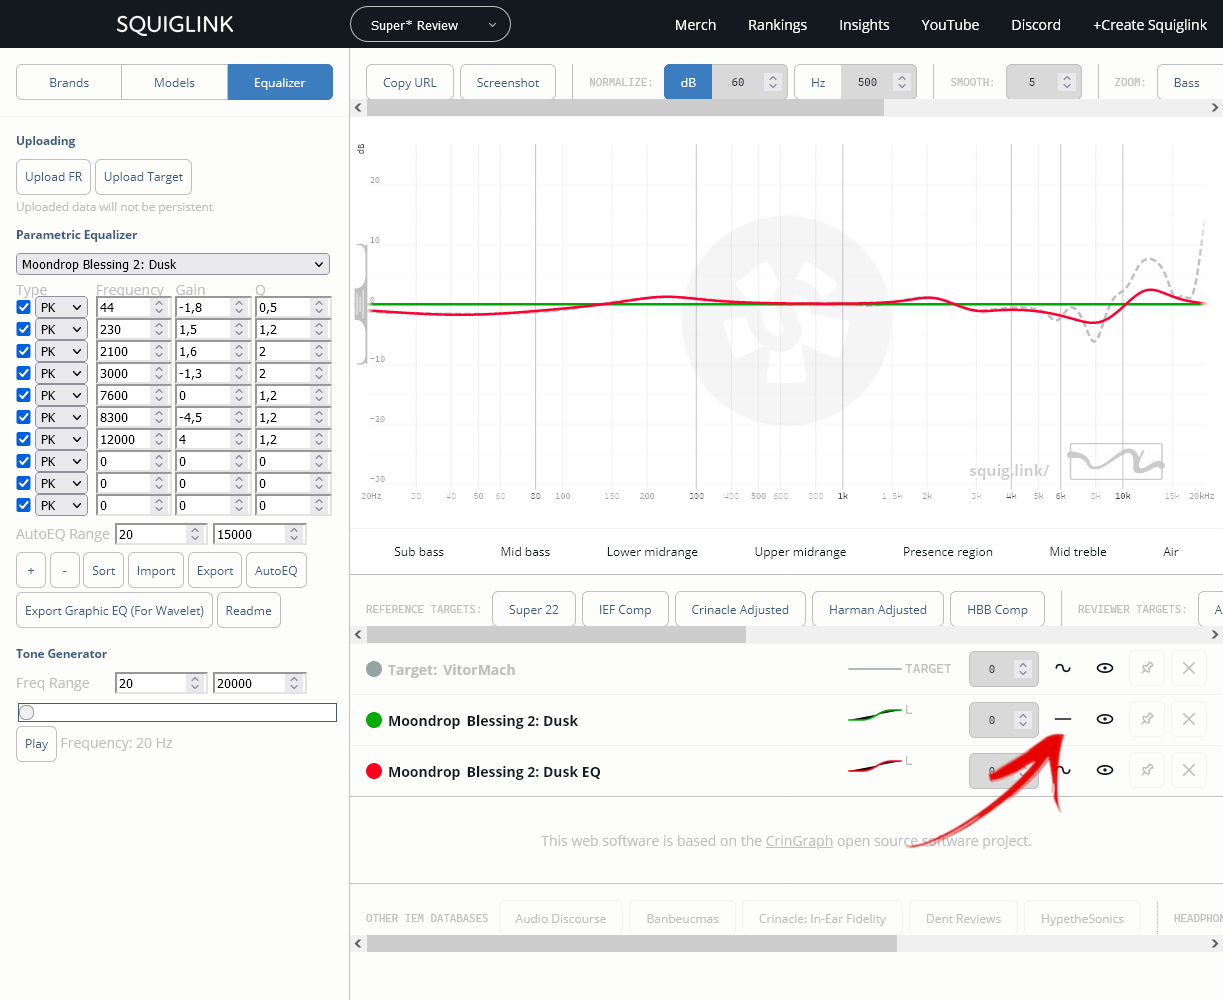
As an added tip, you can hit this button to flatten one of the curves:
This makes it easier to judge how aggresive your equalizer curve is.
Custom CrinGraph
As I mentioned before, CrinGraph is an open-source software available on GitHub. I have decided to host my own instance using GitHub Pages, which is free. The repository contains documentation on the basic configuration for deploying your own instance.
Conclusion
I hope this was useful to you, and feel free to contact me using the Disqus chat below!
Resources
- • EQ settings - Aria
- • EQ settings - Chu
- • EQ settings - Dusk
- • Wavelet settings - Aria
- • Wavelet settings - Chu
- • Wavelet settings - Dusk
Update: November 13, 2022
I have come with a new variant of my target curve. Visit my CrinGraph instance to check it out. I also came up with an EQ for the Dusk conforming to this target. Please note that the first and last filters are shelf filters (LSQ and HSQ respectively) instead of the usual peak (PK) type.
